Introduction and summary
Hot summer days have always posed a risk of health complications, but climate change is causing an increase in prolonged periods of extreme heat. With this has come a rise in incidences of heat-related illness, as more Americans experience health complications and need to seek medical care. The resulting increases in visits to physicians, visits to emergency departments, and admissions to hospitals will inflate U.S. health care costs.
To better understand the health impacts of extreme heat, the authors of this report used available data from Virginia to derive estimates of the increase in health care utilization—including emergency department visits and hospital admissions—and health care costs associated with extreme heat. Daily climate data collected from 15 weather stations that serve the state of Virginia show that during the five summers of 2016–2020, an average of 80 heat event days occurred per summer.1
Based on insurance claims data from Virginia’s all-payer claims database,2 the authors estimate that each summer, heat events resulted in:
- Almost 400 additional ambulatory—or outpatient—care visits for heat-related illness
- Almost 7,000 additional emergency department visits, including more than 4,600 visits for heat-related or heat-adjacent illness
- Almost 2,000 additional heat-related hospital admissions, mostly for heat-adjacent illness
Extrapolated nationally, heat event days would be responsible for almost 235,000 emergency department visits and more than 56,000 hospital admissions for heat-related or heat-adjacent illness, adding approximately $1 billion in health care costs each summer.
The growing threat of extreme heat requires all levels of government and the private sector to confront the fundamental crisis of climate change by taking action to reduce greenhouse gas emissions and to pursue policies that mitigate the effects of extreme heat and the emergencies it creates. These efforts are necessary across the United States, but especially in low-income neighborhoods, communities of color, and other settings where vulnerability to severe weather and climate change is greatest. This report makes the following policy recommendations to systematically address the challenges of extreme heat:
- Reduce greenhouse gas emissions to slow climate change and rising temperature. Extreme heat and heat waves will increase unless governments and the private sector take decisive action to address climate change by shifting from fossil fuel use to clean renewable energy.
- Establish and strengthen federal, state, and local governmental responsibilities for extreme heat protections. Public officials should adopt a whole-of-government approach to extreme heat—and climate change broadly—to facilitate coordinated, cross-sector action.
- Improve data surveillance and prediction capabilities. Jurisdictions require more detailed and timely data, as well as improved modeling methods, to adequately track and predict heat events and their effects on public health.
- Raise public awareness about the risks of extreme heat and protective measures. Long before—and during—heat emergencies, the public should receive clear, timely information about the dangers of extreme heat and how to avoid becoming ill.
- Increase community resilience to extreme heat. Communities should increase tree canopy and take other steps to limit public exposure to extreme heat, as well as prepare comprehensive action plans to deal with heat emergencies in real time.
- Strengthen health care services and early detection of heat-related illness. The public should receive information on the warning signs of, and have access to care for, heat-related illness, while health care systems should train providers on treatment guidelines as well as strengthen infrastructure to maintain services during heat waves and power outages.
Distinguishing between extreme heat, heat event days, and heat waves
Extreme heat refers to abnormally hot temperatures, often defined as temperatures above the 85th, 90th, or 95th percentile for that location.3 For example, a temperature above the 90th percentile means that the temperature in that location has historically been lower on 90 percent of days during that month or season.
Heat events, as used in this report, are general reference to periods of one or more days with extreme heat. This report discusses studies that refer to heat event days, a technical term referring to a specific combination of high temperature, humidity, cloud cover, windspeed, and other climatic conditions. Scientists use the Spatial Synoptic Classification to characterize various combinations of climatic conditions. In this report, a heat event day is one that meets criteria for “dry tropical” or “moist tropical” climatic conditions. (see Methodology)
Heat waves are a series of days with abnormally high temperatures that can be defined in various ways.4 For example, a heat wave in July or August could be defined as two or more consecutive days during which the temperature in a particular location exceeds the 85th percentile of historical temperatures recorded for those months over a specified period of years.
The health effects of extreme heat
The human body is designed to self-regulate its temperature, even when exposed to severe cold or heat. The body adapts to extreme heat by both increasing perspiration (sweating) and evaporative cooling. However, natural systems for thermoregulation can fail when the body experiences prolonged heat exposure, when humidity levels interfere with evaporation, and when dehydration and salt depletion reduce blood pressure and cause electrolyte imbalance. Infants and toddlers, pregnant women, and the elderly have more difficulty regulating their body temperature and face greater risks during extreme heat events, as do people with chronic medical conditions such as heart disease, hypertension, diabetes, and respiratory illnesses.5 Cardiovascular disease is believed to account for about one-fourth of heat-related deaths.6
Medical complications of exposure to extreme heat
Heat-related illnesses include heat cramps, heat exhaustion, and heat stroke:7
- Heat cramps are marked by muscle pain or spasms and heavy sweating during exercise.
- Heat exhaustion occurs when the body struggles to maintain normal core temperatures; symptoms can include a racing heart (rapid pulse), muscle cramps, cold and clammy skin, nausea or vomiting, fatigue, dizziness, headache, or loss of consciousness (syncope).
- Heat stroke, the most severe heat-related illness, occurs when temperature regulation fails and body temperature rises above 103 degrees Fahrenheit. Heat stroke causes the pulse to increase, perspiration to decrease, and the skin to become hot and dry. People can also experience headache, nausea, dizziness, confusion or disorientation, and loss of consciousness.
Patients suffering from heat-related illness may be treated by physicians who do not recognize the syndrome and do not formally assign a diagnostic code for it, instead assigning codes for heat-adjacent illness—the complications that accompany heat-related illnesses, such as dehydration, rapid pulse (tachycardia), dizziness (ataxia, orthostatic hypotension), or syncope. Formal diagnostic codes, which physicians assign for insurance claims and data analysis, are defined by the International Classification of Diseases, now in its 10th edition (ICD-10).8
Patients with obesity or organ diseases such as heart disease, chronic obstructive pulmonary disease, or kidney disease, among others, can experience complications when exposed to extreme heat such as chest pain (angina), shortness of breath (dyspnea), or electrolyte imbalances. Diagnostic codes for their visits may omit mention of heat-related or heat-adjacent illness, referring only to the clinical exacerbations of their chronic disease.
As a result, estimates of the incidence of heat-related illness and deaths are likely undercounts. A study of the 1995 Chicago heat wave estimated that there were more than 700 excess deaths, but only 485 were coded as heat-related deaths on death certificates.9
The medical complications of extreme heat include heat cramps, heat exhaustion, and heat stroke. Research is identifying other medical complications from extreme heat, such as adverse birth outcomes (e.g., low birth weight) and congenital anomalies.10 Although most victims recover by moving to cool areas and rehydrating, more severe symptoms—such as dizziness, confusion, and loss of consciousness—require medical attention. People may seek treatment in ambulatory care settings, such as primary care practices or urgent care centers, or in hospital emergency departments, where they can receive intravenous fluids and other medical care before being discharged home, known as treat-and-release visits. Patients with more severe symptoms may require hospitalization, and some cases are fatal. One study of death certificates from 2004 to 2018 estimated that more than 10,000 Americans died from heat-related illness.11 Another estimated that from 2008 to 2017, as many as 13,000 to 20,000 deaths occurred due to extreme heat.12 According to the National Weather Service, heat is the leading cause of weather-related deaths.13
Factors that exacerbate the health consequences of extreme heat
The risk of falling ill from extreme heat is determined by three variables: weather conditions, including ambient temperature, humidity levels, solar radiation, wind speeds, and duration of heat waves; individual risk factors such as age, preexisting organ diseases, and alcohol use; and community resilience, including access to indoor air conditioning, outdoor shade, and heat absorption from buildings and asphalt. These factors can intersect in vulnerable populations and places, resulting in high rates of heat-related illness.
Vulnerable populations include those with medical or environmental risk factors that heighten sensitivity to heat. These include low-income families, who are disproportionately people of color and who often cannot afford to live in air-conditioned housing14 or in tree-lined neighborhoods.15 They are more likely to lack access to health insurance and affordable health care or transportation, to work in blue-collar jobs and toil long hours outdoors or in hot indoor spaces, and to carry higher medical risks because of comorbid conditions such as hypertension or organ diseases.16 Difficulty affording air conditioning and paying electricity bills is a particular risk factor for heat-related illness. In one study in Oregon, lack of air conditioning was the one common denominator in all deaths from extreme heat.17 A study in Maricopa County, Arizona, found that residents of mobile homes accounted for only 5 percent of the population but 29 percent of indoor heat-related deaths.18
Vulnerability to extreme heat extends to people who are not necessarily socially or economically marginalized, such as children, athletes, participants in outdoor concerts and sporting events, and outdoor workers.19 Other vulnerable populations include those who reside in warm buildings and cannot easily leave, including people incarcerated in jails and prisons, nursing home residents, individuals with disabilities, and infants and children left in hot cars.20
Places can also be vulnerable to heat. Such places include urban heat islands and other areas with disproportionate, unshaded sun exposure and with built environments such as buildings and roads that absorb more heat than natural terrain (e.g., green space). Poorly ventilated indoor areas without fans or air conditioning are also vulnerable to heat, especially in buildings with roofing and other materials that absorb heat and in apartments or other dwellings in the upper stories of buildings, as are areas with little protective tree cover.
Spotlight on Richmond: Community effort to measure daily temperatures
In summer 2017, residents of the city of Richmond, Virginia, participated in a community effort to measure daily temperatures by neighborhood.21 At the hottest time of day, they found a 16 degree Fahrenheit difference between the coolest and warmest neighborhoods, with lower-income communities and communities of color disproportionately exposed to heat extremes. The patterns of excess heat exposure mirrored Richmond’s 1937 Home Owners’ Loan Corporation (HOLC) redlining map.22 According to a subsequent study published in 2020, in Richmond and in 94 percent of cities mapped by the HOLC, formerly redlined communities—which remain mostly poorer communities of color—were significantly hotter during the summer than their whiter, wealthier, greenlined neighbors. Other studies have shown that areas formerly redlined by HOLC also experience greater flood risk,23 poorer air quality,24 and more negative health outcomes than their nonredlined neighbors.25
The risk of heat-related illness intensifies when vulnerable populations are concentrated in vulnerable places, a common occurrence in economically marginalized neighborhoods and communities of color. High-risk groups are often at greatest risk in historically segregated neighborhoods26 and experience the compounded risks that result from diminished protection from extreme heat, greater vulnerability to health complications, and fewer resources to mitigate impact. For example, a study in New York City found that buildings with higher indoor temperatures and humidity were more common in segregated neighborhoods with a larger share of Black residents.27 Other studies have shown that areas that were redlined by the HOLC during the 1930s through 1950s are more likely to be heat islands today and are more vulnerable to other effects of climate change.28 Finally, the populations and places that sometimes face the greatest risks are those that are unaccustomed to extreme heat, such as communities in northern areas of the United States where summer heat is generally less intense and many homes and apartments lack air conditioning.29
The increasing incidence of extreme heat
The incidence of extreme heat is increasing,30 fueled in part by climate change. The upward trend is not always noticeable from one year to the next, but long-term data clearly demonstrate an ominous trajectory. Data compiled by the U.S Environmental Protection Agency (EPA) show a progressive increase in the frequency, duration, and intensity of heat waves since the 1960s.31 (see Figure 1) The average heat wave season in the 50 U.S. cities the EPA studied is currently 49 days longer than in the 1960s, and the trend is likely to worsen without a reduction in carbon emissions and other steps to mitigate climate change. By midcentury (2036–2065), U.S. summers are expected to include 20 to 30 additional days of extreme heat.32
Catastrophic heat waves are also becoming more common. In late June 2021, for example, a week of record-breaking heat struck the Pacific Northwest.33 Temperatures in Portland, Oregon, climbed to 116 degrees Fahrenheit,34 Seattle’s temperature reached 118 degrees Fahrenheit,35 and emergency department visits surged in Alaska, Idaho, Oregon, and Washington.36 The number of officially reported heat-related fatalities—83 deaths in Oregon,37 100 deaths in Washington38—were likely undercounts; one study estimated that these two states experienced more than 600 excess deaths in late June 2021.39
![]()
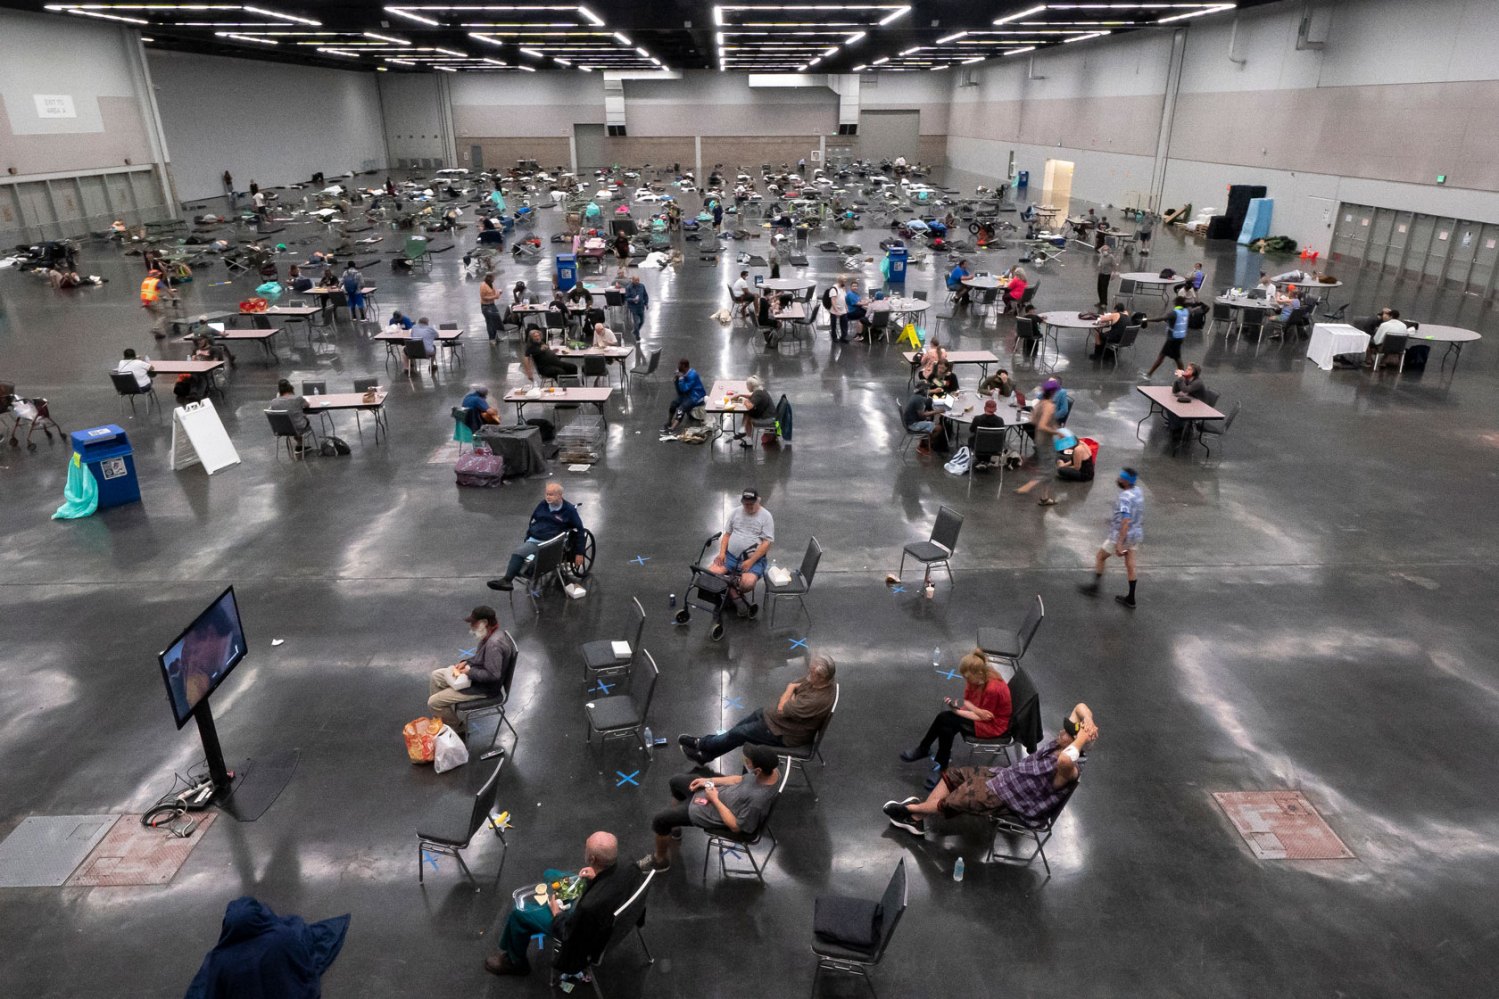
Portland residents fill a cooling center at the Oregon Convention Center during the June 2021 heat wave in Portland, Oregon, on June 27, 2021. Photo credit: Getty/Nathan Howard
Effects of extreme heat on health outcomes and the economy
The health impact of extreme heat is larger than official statistics suggest. For every person seeking medical attention for heat-related illness, countless more suffer at home, either from heat-related illness or complications from preexisting conditions. Heat-related power outages and blackouts deactivate home medical devices,40 such as oxygen pumps and dialysis machines, on which people with chronic diseases rely. A recent study estimated that electrical grid failures during heat waves could double heat-related mortality in some cities.41 Heat waves also affect mental health42 and are associated with higher rates of crime43 and violence.44 Extreme heat can force school closures and make it difficult for students45 to attend class or concentrate. People dealing with heat emergencies must often miss work,46 and lost wages are themselves a predictor of health complications.47 Missed work creates economic precarity for low-income families, as do higher electrical bills to run air conditioners.
The broader impact of extreme heat on the U.S. economy, in addition to increased health care spending, includes decreased workforce productivity, increased heat-related work site injuries48 and illness,49 and disrupted business operations caused by power outages50 and heat damage to materials and infrastructure.51 Certain industries, such as agriculture, construction, and tourism, are disproportionately affected by temperature extremes. Warmer temperatures also disrupt the environment and ecosystems;52 damage wildlife and crop yields, promote invasive species;53 and cause water shortages, habitat loss, and wildfire risks,54 among other effects.
Article spotlight
Effects of extreme heat on health care utilization
Research to quantify the impact of extreme heat on health care utilization—including visits to emergency departments and hospital admissions—is in its infancy and has been easiest with respect to acute heat waves. One study estimated that the June 2021 heat wave in the Pacific Northwest increased the incidence of emergency department visits for heat-related illness ninefold in Seattle and seventeenfold in Portland.55 Additional insights are available from the National Syndromic Surveillance Program, a collaboration among the U.S. Centers for Disease Control and Prevention (CDC) and other federal agencies, local and state health departments, and other partners to share electronic patient encounter data. Data from that program show that the June 2021 heat wave was accompanied by a conspicuous spike in emergency department visits in U.S. Department of Health and Human Services Region 10, which includes Alaska, Idaho, Oregon, and Washington. (see Figure 2)
Less clear is how many excess emergency department visits can be attributed to extreme heat over a summer season or year. For example, Figure 2 also shows that daily emergency department visits for extreme heat in May 2019 and June 2019 varied when compared with those same months in 2021 and exhibited different patterns across Region 10 and the rest of the United States in both years. Determining how much of this variation is due to extreme heat is difficult without knowing daily temperatures by locality, the size of the affected population, and other variables that influence the risk of heat-related illness.
Estimates that take these factors into account require more sophisticated research methods. Researchers at UCLA examined county-level data on emergency department visits in California from 2009 to 2018 and ZIP code-level data on heat events collected from weather stations.56 They found that the average heat event day resulted in 8,222 excess emergency department visits across the state for heat-related illness and that the rate varied significantly by county. In the next section, researchers adapted this analysis to evaluate the effects of extreme heat in Virginia.
The Virginia study
For this original analysis for the Center for American Progress, the authors accessed insurance claims data from Virginia’s all-payer claims database. (see Methodology for full information) This analysis used data on health care encounters by ZIP code tabulation areas (ZCTAs) for the five summers from 2016 to 2020 to calculate the rate of ambulatory care encounters, emergency department visits, and hospitalizations coded for heat-related illness, heat-adjacent illness, or organ diseases. Daily climate data collected from 15 weather stations that serve the state were used to determine the number of heat event days each ZCTA experienced and the size of the exposed populations.
The impact of heat event days each summer in Virginia
400
Additional ambulatory care visits
7,000
Additional emergency department visits
2,000
Additional heat-related hospital admissions
As shown in Table 1, the authors compared health care utilization in Virginia on heat event days and nonheat event days. They found that during the summers of 2016 to 2020, visits to Virginia’s emergency departments and hospitalizations due to heat-related illness increased 179 percent and 217 percent, respectively, on heat event days compared to nonheat event days. The average heat event day was associated with approximately five additional ambulatory care visits, 59 additional emergency department visits, and 25 additional hospitalizations for heat-related and/or heat-adjacent illnesses.57 Multiplying these additional visits by the 80 heat event days per summer that Virginia averaged during this time period suggests that heat events across the state resulted in:
- Almost 400 additional ambulatory care visits per summer for heat-related illness
- Almost 7,000 additional emergency department visits per summer, including more than 4,600 visits for heat-related or heat-adjacent illness
- Almost 2,000 additional heat-related hospital admissions per summer, mostly for heat-adjacent illness
National impact of extreme heat on health care utilization and costs
The results of the Virginia study help put the national impact of extreme heat into perspective. If the Virginia data applied to all U.S. census tracts in the contiguous United States, heat event days would be responsible each summer for almost 235,000 additional emergency department visits for both heat-coded and nonheat-coded visits and more than 56,000 additional hospital admissions for heat-related or heat-adjacent illness. (see Table 2) If treat-and-release emergency department visits and hospital admissions average $757 and $14,900, respectively—as some federal data suggest58—heat event days would cost an estimated $1 billion every summer, with approximately $177.3 million in emergency department visits and almost $834.9 million in hospital admissions for heat-related or heat-adjacent illnesses.
The nationwide costs of extreme heat per summer
$1B
Cost of heat event days
$177.3M
Cost of emergency department visits
$834.9M
Cost of hospital admissions
Several caveats about these estimates should be kept in mind. Susceptibility to heat-related illness is influenced by climatic conditions, individual risks, and community resilience. Although the researchers held climatic conditions constant in this extrapolation for all contiguous U.S. census tracts by using a common definition for heat event days, the prevalence of individual health risks (e.g., comorbidities) and the resilience of communities to heat varies dramatically across U.S. geographic regions. Moreover, the range of climatic conditions in Virginia is typical of much of the country but is not representative of areas with more extreme conditions.
Further research is needed to accurately monetize the impact of extreme heat on health care costs, but these preliminary estimates begin to illustrate the potentially vast strain of heat-related health care costs on the U.S. economy.
Yet health care costs represent only one category of economic strain that extreme heat imposes on individuals and families, employers and industries, government, the United States, and the global economy. Individuals and families also bear the cost of utility bills, lost wages, food waste and other losses associated with power outages. Employers and industries must cover the costs of increased health care for insured employees and losses resulting from decreased workforce productivity and increased absences, disrupted operations caused by extreme heat and power outages, lost revenue as customers stay home, and damage to natural resources such as crops and infrastructure such as railways and runways.59 Governments and taxpayers bear the cost of restoring power, fire and rescue services, and the operation of cooling centers, as well as repair of public infrastructure damaged by heat and the work of public health departments to improve community resilience. According to one study, heat-induced lost labor productivity alone costs the nation approximately $100 billion per year.60 Further research that considers other ripple effects is needed to fully quantify the impacts of extreme heat on the U.S. economy.
Policy recommendations to address the impact of extreme heat
The growing threat of extreme heat requires all levels of government and the private sector to confront the fundamental crisis of climate change by taking urgent action to reduce greenhouse gas emissions. In addition, all levels of government must take on responsibilities to protect public health and physical infrastructure from extreme heat, improve data collection and prediction capabilities, raise public awareness, increase community resilience, and strengthen health care services and the early detection of heat-related illness. These efforts are necessary everywhere, but especially in low-income neighborhoods, communities of color, and other settings where vulnerability to severe weather and climate change is greatest. Policies oriented toward environmental justice, such as the Justice40 initiative and the Inflation Reduction Act of 2022’s Greenhouse Gas Reduction Fund and Environmental and Climate Justice Block Grants for vulnerable communities, are essential, as is community engagement to elevate the voices of affected populations in developing policies and response plans.
Article Spotlight
Reduce greenhouse gas emissions to slow climate change and rising temperatures
Extreme heat and heat waves will increase unless the nation—and the world—takes decisive action to address climate change by shifting away from fossil fuel use and toward clean renewable energy to reduce greenhouse gases. The Inflation Reduction Act makes historic investments in tackling climate change and environmental injustice, building a clean energy economy, and creating well-paying jobs.61 That law’s provisions, coupled with ambitious climate action from state and other subnational actors, are intended to reduce greenhouse gas emissions to levels that are 41 percent to 51 percent below 2005 levels in 2030.62 The law calls for large investments that could help build the nation’s resilience to extreme heat:
- $1 billion in urban forestry grants to plant trees and expand green space and community forests in urban areas, an effort to provide more equitable access to nature and build resilience to extreme heat in marginalized communities
- $3 billion—including $1.1 billion for disadvantaged communities—in Neighborhood Access and Equity Grants to address urban heat islands and gaps in tree canopy
- $4.5 billion to fund Home Electrification and Energy Efficiency Rebates, which offer $8,000 for installing heat pumps and $1,600 for adding insulation, air sealing, and ventilation
- $3 billion for Environmental and Climate Justice Block Grants to reduce pollution and climate threats in communities overburdened by environmental hazards
- $27 billion for the Greenhouse Gas Reduction Fund to mobilize financing and provide grants, loans, and other forms of financial assistance for pollution-free energy and climate projects that reduce local pollution and greenhouse gas emissions, with a focus on projects that benefit low-income and disadvantaged communities, including communities of color
Article Spotlight
Much more must be done to accelerate the transition from fossil fuels to clean renewable energy in order to curb climate change and slow temperature increases. Responsibilities fall on all sectors to narrow their carbon footprint and increase reliance on clean energy. For example, the health care industry, including hospitals and pharmaceutical companies, has a large carbon footprint and should, at a minimum, begin reporting carbon emissions and taking steps to decarbonize.63 Congress is currently considering other legislation, such as the Green New Deal for Health Act and the Protecting Moms and Babies Against Climate Change Act, to accelerate action on climate change.64
Establish and strengthen governmental responsibilities to address extreme heat
Federal, state, and local governments should adopt a whole-of-government approach to extreme heat—and to climate change broadly—to facilitate coordinated, cross-sector action.65 Coordination is especially important during heat emergencies but can also enhance prevention and mitigation efforts. For example, governments can centralize the development and dissemination of high-quality resources, including best practices for dissemination to the public, first responders, employers, and community organizations. Governmental agencies can also work to ensure that resources are getting to those most at risk from extreme heat.
States and municipalities should appoint heat officers and emergency managers to coordinate policies on extreme heat. State public health departments have played leadership roles in developing climate and heat response plans in Arizona, California, New Hampshire, Oregon, and Wisconsin.66 Initiatives to address extreme heat should also be included in regional master plans. Finally, local health departments have led development of climate and heat adaptation plans for cities such as Chicago, New York, and San Francisco, as well as Miami-Dade County, among others.67 A recent analysis identified 21 heat action plans for local jurisdictions.68
Spotlight on Richmond: Regional master plans to combat extreme heat
Among the 17 goals in “Richmond 300,” the master plan for Richmond is Goal 17.3, to “reduce urban heat, prioritizing areas with a high heat vulnerability index rating.”69 City leaders are using a heat index, derived from local temperature measurements and socioeconomic data, to identify heat islands and prioritize affected neighborhoods. (see Figure 3 below) Proposed changes in these neighborhoods include lighter-colored road and roof surfaces, green roofs, varied building heights to encourage air circulation, tax and zoning policies to limit parking lots, replacement of parking lots with mixed-use developments and parks, and increased tree canopy and green space.
Historically marginalized communities are also the focus of the city’s equity-oriented sustainability plan, “RVAgreen 2050,” which calls for cooling relief and utility bill assistance.70 The plan emphasizes an urban heat island reduction program that includes efforts to increase tree canopy, such as a forest master plan, an adopt-a-tree program, and proffers and impact fees to expand green space. The plan also calls for mandates for benches and shade at bus stops, depaving programs, and bans against net increases in impervious surfaces on new projects.
Leadership at the national level is essential to drive change. In April 2023, the White House deepened its commitment to a coordinated, cross-government approach to climate change that includes attention to extreme heat.71 Executive branch agencies at the federal, state, and local level are playing important roles in addressing extreme heat and climate policy; noteworthy examples at the federal level include the Office of Climate Change and Health Equity in the U.S. Department of Health and Human Services, the CDC Climate and Health Program, the Climate Program Office of the National Oceanic and Atmospheric Administration, and the EPA Office of Environmental Justice.72 Many of these agencies, however, are inadequately funded and staffed.73 Congress should increase funding and staffing to levels that the extreme heat crisis demands.
Article Spotlight
Improve data surveillance and prediction capabilities
The National Weather Service provides forecasts and alerts for impending heat events and meteorological data for past heat events, but jurisdictions require more detailed and timely data to adequately track and predict heat events and their effects on public health. Surveillance systems are emerging that can help agencies and the public monitor adverse effects of heat events in real time:
- States are collecting data on emergency medical response/911 calls for heat emergencies and on emergency department visits for heat-related illness. California and Virginia are among a number of states that have established dashboards to track the number and rate of excess emergency department visits for extreme heat at the state and county level.74
- The CDC Climate and Health Program’s National Syndromic Surveillance Program aggregates these data and operates its own dashboard—the Heat and Health Tracker—to provide counties with ZIP code-level data on recent heat trends, emergency department visits for heat-related illness, and forecasts of the number of days of extreme heat.75
- The Climate Mapping for Resilience and Adaptation program provides a national mapping tool and dashboard to increase national preparedness.76
- The emPOWER program—a partnership between the Administration for Strategic Preparedness and Response and the U.S. Centers for Medicare and Medicaid Services—provides federal data, mapping, and artificial intelligence tools to address climate threats to Medicare beneficiaries.77
- The U.S. Department of Health and Human Services issues its semi-monthly Climate and Health Outlook to alert health care professionals about climate threats forecast for the coming months.78
However, more information is needed for both short-term and long-term planning and emergency management at the national, state, and local levels. Forecasting heat events with greater accuracy and more advanced warning will require investments in research to improve modeling techniques. More accurate methods for identifying vulnerable places and populations are also essential to properly target investments to build community resilience. At present, tools such as the CDC Heat and Health Tracker and the Extreme Heat Vulnerability Tool rely on composite indices, such as the Social Vulnerability Index, that assess generic risk factors—such as socioeconomic status, household characteristics, racial and ethnic composition, and housing and transportation conditions—that are important but are not specific to heat. A neighborhood’s vulnerability to heat is more accurately assessed by also considering other household conditions, such as access to air conditioning and affordable energy; the built environment, such as building design and tree canopy; and climate, including wind and humidity.79
Article Spotlight
Raise public awareness about the risks of extreme heat and protective measures
Governments, employers, public health agencies, health care systems, and other institutions should expand efforts to educate the public about the dangers of extreme heat as summer approaches, long before emergencies occur. They should deliver practical information on how to stay safe during hot weather, what to do on heat alert days, where cooling centers are located, which symptoms of heat-related illness to watch for and which require medical attention, how to deal with poor air quality, and how to plan ahead for power outages and evacuations. Philadelphia has a warning system that has been proven to save lives by promptly educating the public and quickly deploying response measures, such as extending hours at cooling centers.80
Local governments, employers, and health care systems should adopt plans to push out their messaging ahead of and during extreme heat events and heat waves and should tailor the messages to their audiences. For example, school systems should clarify policies on outdoor recess and sports activities. Construction crews should be informed about safety policies on jobsites. Health systems and clinics should contact at-risk patients with guidelines on how to stay safe.
Increase community resilience to extreme heat
As noted earlier, community resilience ranks among the three most important predictors of heat-related illness, along with climate conditions and individual risk factors. Physicians and hospitals can do their best to treat heat-related illness, but patients remain vulnerable after discharge if they return to the same living conditions and neighborhoods that made them sick in the first place. Efforts to limit the impact of extreme heat on communities are therefore essential.
The American Planning Association states that community resilience to heat depends on plans for 1) heat mitigation and 2) management of heat events.81 Planning for both should be standard practice for employers, industries, and other sectors, and federal, state, and local governments should integrate it into regional planning, regulations, and public investments. State and local public health departments are leading many efforts at building resilience, and some of the most innovative strategies have been inspired by community coalitions and grassroots organizations.82
Heat mitigation
Heat mitigation refers to strategies to reduce the built environment’s contribution to heat exposure by making changes in land use, building design, and waste heat reduction. For example, builders and developers can use heat-reflective roofing materials—also known as cool roofs—and change the design features of buildings, parking areas, and green space. Many communities are launching initiatives to increase green space, donate and plant trees, build more shaded areas, and reduce exposed areas of asphalt, especially in heat islands.83 (see text box below) The Federal Emergency Management Agency provides funding to support such efforts.84
Management of heat events
Heat management refers to strategies to respond to heat events. These include establishing early warning systems for heat emergencies; ensuring access to air-conditioned spaces and cooling centers; purchasing air conditioners and generators for low-income residents; providing assistance with electricity bills; ensuring reliable energy during heat events, including backup systems for power outages; reducing personal heat exposure; emergency management planning; maintaining dependable transportation; and coordinating with local health departments and health care systems. Federal agencies are collaborating on initiatives to protect workers from extreme heat. The Occupational Safety and Health Administration has set standards for employers to reduce heat exposure at work sites, and enforcement and inspections can be leveraged to encourage compliance. Jails and prisons can be required to maintain safe indoor temperatures.85
Spotlight on Richmond: Efforts to increase resilience to extreme heat
Efforts to increase resilience to extreme heat in Richmond include those initiated by local government, as well as those led by residents and community organizations. For example, the mayor relied on community input to convert 36 acres of unused parcels into public green spaces, targeting heat islands on the city’s south side. Grassroots organizations lead many efforts as well.86 For example, in 2018, 160 volunteers helped plant more than 60 trees in a low-income Richmond neighborhood.87 In another case, a local museum converted asphalt parking into six acres of public green space.88 As part of the Throwing Shade in RVA program, the same museum partnered with a nonprofit organization to engage local teenagers, who used models, heat lamps, and infrared thermometers to learn about heat islands and were then encouraged to design solutions.89 These grassroot and community-based approaches have the direct benefit of reducing temperatures in heat islands, but they also have the potential to increase awareness, strengthen ties in the community, and improve social and mental health outcomes.
Strengthen health care services and early detection of heat-related illness
Health care is an important component of effective heat management and requires the public to have access to health care services and the prompt clinical recognition and treatment of heat-related illness. New technologies and software, such as smart phones and watches, could help victims recognize heat-related symptoms before complications arise. Obtaining care for heat-related illness is more difficult for people with limited access to health care, such as those who lack health insurance or paid leave, who live in areas with shortages of health care facilities and providers (especially primary care), and who lack affordable transportation to reach emergency departments and hospitals. Policies to address these barriers are essential for heat-related illness and health care generally. In health professional schools and continuing education programs, physicians and first responders should receive updated training on how to optimize the diagnosis and treatment of heat-related illness. These efforts can be targeted to providers in vulnerable communities. For example, the Miami-Dade County Heat Task Force collaborated with Florida Clinicians for Climate Action to educate clinicians at hospitals, federally qualified health centers, and other health care facilities located in at-risk ZIP codes and to provide written materials that they can distribute to patients.90
Hospitals and other health care facilities should strengthen their infrastructure and resilience in order to maintain operations during heat waves and power outages. Incentives can encourage health systems to make these changes. For example, the Centers for Medicare and Medicaid Services recently issued a waiver to allow hospitals to install microgrids, which can provide emergency power using clean energy technologies such as fuel cells and solar.91 Health systems are also being encouraged to address the social determinants of health, such as food insecurity and unstable housing. Vulnerability to heat should join the list of social needs that clinicians routinely assess during hot weather and especially during heat events. For example, the Climate Resilience for Frontline Clinics Project provides toolkits on heat-related illness that include practice guidelines for clinicians, educational materials for patients, and resources for practice administrators.92
Conclusion
In the United States and around the world, extreme heat is becoming increasingly common and more dangerous. The acute damage produced by extreme heat events and the ripple effects of chronic heat exposure have broad implications, among them an increase in heat-related illnesses and heightened demand for health care services. The research reviewed in this report estimates that visits to emergency departments and hospital admissions during heat event days are costing the nation approximately $1 billion every summer. The human and economic costs of these trends are likely to climb unless immediate and bold actions are taken to shift away from fossil fuel use to clean energy sources, curbing rising temperatures in the long term, and to mitigate the damage of heat events in the short term. Similar concerns apply to planning for extreme cold during winter months, the increasing frequency and intensity of extreme weather events such as flooding and wildfires, and other climate change threats. The price of inaction is costly, dangerous, and unsustainable.
Acknowledgments
The authors would thank Center for American Progress staff for their support, guidance, and thoughtful review of the report and analysis. They extend a special thank you to Marquisha Johns, Jill Rosenthal, Emily Gee, Cathleen Kelly, and Mariam Rashid.
Methodology
Data on health care utilization
This study, conducted for CAP by researchers from Virginia Commonwealth University from fall 2022 to the present day, used data on health care encounters by ZIP Code Tabulation Areas for five summers—May–September, 2016–2020—to calculate the per capita rate of ambulatory care encounters, emergency department visits, and hospitalizations, including those coded for heat-related illness, heat-adjacent illness, or organ diseases. The data were obtained from Virginia’s All-Payer Claims Database.93 Ambulatory care encounters included any clinical encounter that was not coded as an emergency or hospital visit. This included all outpatient visits, such as those at primary care, urgent care, or specialty practices or clinics.
The category of heat-related illness included diagnoses directly attributed to heat exposure, coded as “exposure to excessive natural heat (ICD-10 code X30) or “effects of heat and light” (T67). Heat-adjacent illness included secondary conditions that can occur among people exposed to severe heat, coded as “volume depletion” (ICD-10 code E86), “dizziness and giddiness” (ICD-10 code R42), “headache” (ICD-10 code R51), “malaise and fatigue” (ICD-10 code R53), or “syncope and collapse” (ICD-10 code R55). Organ system diseases included chronic disease complications, coded as “cardiovascular” (ICD-10 codes I00–I99), “respiratory” (ICD-10 codes J00–J99), “acute kidney failure and chronic kidney disease” (ICD-10 codes N17–N19), “disease of urinary system” (ICD-10 codes N00–N39), “diabetes” (ICD-10 codes E08-E13), and “disorders of fluid, electrolyte, and acid-base balance” (ICD-10 code E87).
Data on climatic conditions
Daily climate data collected from 15 weather stations that serve the state were used to determine the number of heat event days experienced by each ZCTA and the size of the exposed population. A heat event day was defined as one that met the criteria for dry tropical or moist tropical climatic conditions under the Spatial Synoptic Classification System.94
Spatial Synoptic Classification System
Dry polar: The coolest temperatures observed in a location for a particular time of year, associated with clear, dry conditions
Dry moderate: Mild temperatures, associated with dry, comfortable conditions
Dry tropical: Hottest and driest conditions in a location, usually exceeding 95 degrees Fahrenheit
Moist polar: Cloudy, humid, and cool, typical for winter
Moist moderate: Cloudy, but considerably warmer and more humid than moist polar, sometimes associated with fog and light rain
Moist tropical: Very warm—typically associated with the location’s highest temperatures—and humid, muggy, and uncomfortable, conditions that are prevalent in summer
Moist tropical plus: A subset of moist tropical days that are most oppressive, associated with higher dewpoint temperatures (in the 90s) and the warmest overnight temperatures
Transitional: Days with rapid changes in synoptic conditions, characterized by large shifts in pressure, dew point, and wind over the course of the day
Analytic methods
The researchers compared health care utilization by ZCTA on heat event days and nonheat event days. During the 2016–2020 period, Virginia averaged 80 heat event days and four extreme heat days per summer. Across the areas served by the 15 weather stations, there was some variation in the number of heat event days—reflecting regional differences in climate conditions—and in the size of the population exposed. Additional day-to-day variation in emergency department and hospital admissions occurs even on days with normal temperature. To account for these sources of variation, the researchers used a generalized linear mixed Poisson regression model to estimate excess admissions on heat event days.
The net increase in utilization on heat event days is reported in the main text. All increases were statistically significant (p < 0.01), except for the increase in the number of hospital admissions for any reason and of emergency department visits or hospitalizations for organ diseases. The rate ratio was applied statewide to estimate increases in utilization for Virginia. The researchers also calculated results for a three-day lag (to account for visits within 72 hours of a heat event) and for days with extreme heat events.
National extrapolation
The researchers collected climate data from 298 weather stations in the contiguous United States (excluding Alaska, Hawaii, and U.S. territories), identifying the number of heat event days detected by each weather station during the summers of 2016–2020 and the size of the population in the ZCTA in closest proximity to each weather station, multiplying the population count of each ZCTA by the per capita rates for increased utilization calculated in Virginia, and summing the results for all heat events days during each to determine total increases in emergency department visits and hospitalizations in the contiguous United States. The text reports rounded averages for all five summers.
The study did not include a formal econometric analysis, but approximate costs for emergency department visits and hospitalizations were used to provide a sense of perspective about the potential economic impact on the nation.
Data from the Healthcare Cost and Utilization Project (HCUPnet) were used for this preliminary estimate, which focused on costs (in distinction from charges or expenditures).95 The National Emergency Department Sample (NEDS) database estimates that the average overall hospital costs per treat-and-release emergency department visit was $757 in 2020.96 The National Inpatient Sample (NIS) database estimates that the average overall hospital costs per stay was $14,900 in 2020.97 Average overall costs do not account for variation in costs across U.S. regions and health system markets and are based on costs of care for all diagnoses. Costs of care for heat-related illness, which are likely to differ from overall averages, could not be examined in this study.
Estimates apply to the contiguous United States and therefore underestimate costs of care for extreme heat in Hawaii, Alaska, and U.S. territories. The definition of costs differs from charges and expenditures, neither of which are examined here.